|


|
This page describe very
interesting statistics and math curiosities that may surprise you !
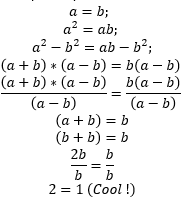
PROOF
THAT 1 EQUALS 2

Proof:
Description:
[1] We start with: a=b;
[2]
Multiply both sides by “a”: a^2=ab;
[3]
Subtract b squared from both sides: a^2-b^2=ab-b^2;
[4]
Factorize: (a+b)*(a-b)=b(a-b)
[5]
Divide both sides by (a-b): ((a+b)*(a-b))/((a-b) )=(b(a-b))/((a-b)
)
[6] So
we have: (a+b)=b
[7]
Because we said a=b in the first step: (b+b)=b
[8]
Dividing both sides: 2b/b=b/b
[9]
Finally: 2=1 (Cool !)
The
problem is in step 5. If a=b, then a-b=0 should not be in the
denominators…
THERE
ARE FAR LESS STARS THAN TREES

According
to
statistics, there are more trees on Earth than there are stars in the
Milky Way. Today, there are around 3 trillion trees and 400 billion
stars.
(brightside.me)
THE
PEOPLE’S REPUBLIC OF CHINA IS KNOWN AS, “THE GOLDEN
REPUBLIC”

There
is more gold in China than in any other country. Research has found
that 440 tons of gold are mined in China every year.
(brightside.me)
EVERY
CLICK, EVERY VIEW AND EVERY SIGN-UP ON INTERNET IS RECORDED SOMEWHERE

Depending
on
your view, this is either very creepy or fantastically
interesting. As we’re data nerds here at Brandwatch
we fall
firmly in the second camp.
We
come across all
sorts of interesting stats about social media sites and users, so
we’ve collated the best of them in these bumper facts list.
And
it comes as a great fact sheet to give context to your social media
marketing efforts.
For
the curious,
these represent a series of numbers that boggle the mind, users counted
in tens and hundreds of millions, and time in millions and billions of
hours. For marketers, knowing the statistics behind the social networks
can inform strategy and spend, allowing focused targeting of users.
(brandwatch.com)
IN
THE U.S., 1,700 PEOPLE BECOME MILLIONAIRES EVERY DAY
There
are many more
millionaires in the world than you might think. In the U.S., 1,700
people become millionaires every day. According to statistics, in the
U.S., there are more than 8 million families whose yearly income is
more than $1 million — and this number doesn’t
include any
property or jewelry.
(brightside.me)
MCDONALD’S
SELLS 75 BURGERS PER SECOND

One
of the
most popular fast food restaurants, McDonald’s sells around
75
burgers a second. They even have a special website which can help you
track how many products have been sold and how many clients have been
served.
(brightside.me)
NUMBERS
FROM BIG TECH COMPANIES
4Chan:
27.7 million users
Airbnb:
150 million users
Facebook:
2.072 billion users
Flickr:
90 million users
Google+:
111 million users
Instagram:
800 million users
LinkedIn:
500 million users
MySpace:
15 million users
Periscope:
10 million users
Pinterest:
200 million users
Reddit:
234 million users
Snapchat:
178 million daily users
Twitter:
330 million users
Wechat:
1.12 billion users
Weibo:
600 million users
WhatsApp:
900 million users
Youtube:
1.5 billion users
(brandwatch.com)
YOU
MAY WALK AROUND EARTH 4.5 TIMES DURING YOUR LIFE
On
average, a
person makes 7,500 steps a day with an average life expectancy of 80
years. Using this data, scientists calculated that a person can walk
180,000 kilometers during their lifetime. This means that in your life,
you can walk around the equator 4.5 times.
(brightside.me)
SOCIAL
MEDIA STATISTICS
For
context, as of April 2018, total worldwide population is 7.6 billion
The
internet has 4.2 billion users
There
are 3.03 billion active social media users
On
average, people have 5.54 social media accounts
91% of
retail brands use 2 or more social media channels
81% of
all small and medium businesses use some kind of social platform
Internet
users have an average of 7.6 social media accounts
Social
media users grew by 121 million between Q2 2017 and Q3 2017.
That
works out at a new social media user every 15 seconds.
Facebook
Messenger and WhatsApp handle 60 billion messages a day
(brandwatch.com)
FOR
THE PAST THOUSAND YEARS, EARTH’S POPULATION HAS GROWN 22
TIMES BIGGER
The
population of
Earth has grown more than 22 times from the year 1000 to 2000. In July
of the year 1000, there were 275,000,000 people; and in July of the
year 2000, there were 6,145,006,989 people.
(brightside.me)
GERMANY’S
POPULATION HAS THE LOWEST PERCENTAGE OF CHILDREN
Children
aged 0 to
14 years make just 12% of the population of Germany, whereas in Kenya
the same age group makes up 40% of the population.
(brightside.me)
HOW
MANY PEOPLE ARE BORN/DIE EVERY DAY IN THE WORLD?
19
births/1,000 population
8
deaths/1,000 population
131.4
million births per year
55.3
million people die each year
360,000
births per day
151,600
people die each day
15,000
births each hour
6,316
people die each hour
250
births each minute
105
people die each minute
Four
births each second of every day
Nearly
two people die each second Average life
expectancy at birth is approximately 67 years.
(Population
Reference Bureau & The World Factbook -Central Intelligence
Agency; quora.com)
GOOGLE
STATISTICS

Google
processes 100 billion searches a month
That’s
an average of 40,000 search queries every second
91.47%
of all internet searches are carried out by Google
Those
searches are carried out by 1.17 billion unique users
Every
day, 15% of that day’s queries have never been asked before
Google
has answered 450 billion unique queries since 2003
60% of
Google’s searches come from mobile devices
By
2014, Google had indexed over 130,000,000,000,000 (130 trillion) web
pages
To
carry out all
these searches, Google’s data center uses 0.01% of worldwide
electricity, although it hopes to cut its energy use by 15% using AI
(brandwatch.com)
SOCIAL
VIDEO STATISTICS
Facebook
now sees 8 billion average daily video views from 500 million users
Snapchat
users also sees 8 billion average daily video views
US
adults spend an average of 1 hour, 16 minutes each day watching video
on digital devices
Also
in the US, there were 175.4m people watching digital video content
78% of
people watch online videos every week, 55% watch every day
It’s
estimated that video will account for 74% of all online traffic in 2017
(brandwatch.com)
FACEBOOK
STATISTICS

Facebook
adds 500,000 new users every day; 6 new profiles every second
68% of
all Americans are on Facebook
79% of
all online US adults use Facebook
76% of
Facebook users check it every day
The
average (mean) number of friends is 155
Half
of internet users who do not use Facebook themselves live with someone
who does
Of
those, 24% say that they look at posts or photos on that
person’s account
There
are an estimated 270 million fake Facebook profiles
(brandwatch.com)
THE
TOP 10 CAUSES OF DEATH
Of the
56.9 million
deaths worldwide in 2016, more than half (54%) were due to the top 10
causes. Ischaemic heart disease and stroke are the world’s
biggest killers, accounting for a combined 15.2 million deaths in 2016.
These diseases have remained the leading causes of death globally in
the last 15 years.
Chronic
obstructive
pulmonary disease claimed 3.0 million lives in 2016, while lung cancer
(along with trachea and bronchus cancers) caused 1.7 million deaths.
Diabetes killed 1.6 million people in 2016, up from less than 1 million
in 2000. Deaths due to dementias more than doubled between 2000 and
2016, making it the 5th leading cause of global deaths in 2016 compared
to 14th in 2000.
Lower
respiratory
infections remained the most deadly communicable disease, causing 3.0
million deaths worldwide in 2016. The death rate from diarrheal
diseases decreased by almost 1 million between 2000 and 2016, but still
caused 1.4 million deaths in 2016. Similarly, the number of
tuberculosis deaths decreased during the same period, but is still
among the top 10 causes with a death toll of 1.3 million. HIV/AIDS is
no longer among the world’s top 10 causes of death, having
killed
1.0 million people in 2016 compared with 1.5 million in 2000.
Road
injuries killed 1.4 million people in 2016, about three-quarters (74%)
of whom were men and boys.
(www.who.int)
WORLD
GDP PER CAPITA
Three
lists of
countries below calculate gross domestic product (at purchasing power
parity) per capita, i.e., the purchasing power parity (PPP) value of
all final goods and services produced within a country in a given year,
divided by the average (or mid-year) population for the same year.
As of
2017, the average GDP per capita (PPP) of all of the countries of the
world is USD $17,300.
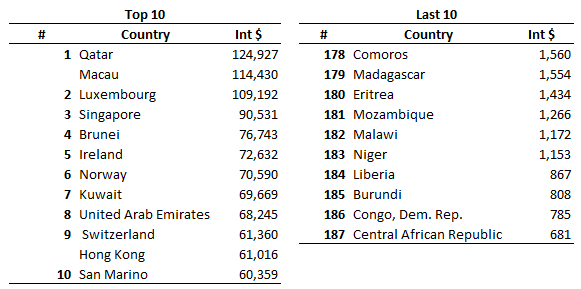
Complete
list:
https://en.wikipedia.org/wiki/List_of_countries_by_GDP_(PPP)_per_capita
WORLD
GDP
Gross
domestic
product (GDP) is a monetary measure of the market value of all the
final goods and services produced in a period (quarterly or yearly) of
time. Nominal GDP estimates are commonly used to determine the economic
performance of a whole country or region, and to make international
comparisons. Nominal GDP per capita does not, however, reflect
differences in the cost of living and the inflation rates of the
countries; therefore, using a basis of GDP per capita at purchasing
power parity (PPP) is arguably more useful when comparing differences
in living standards between different nations.
Per
the International Monetary Fund (2017):
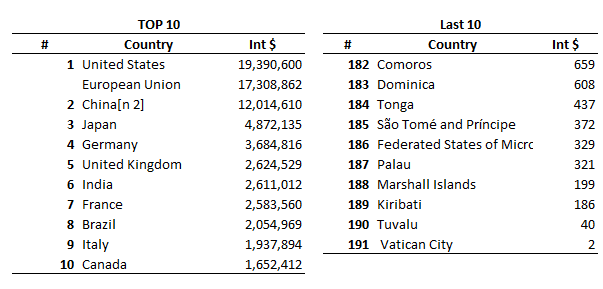
Complete
list: https://en.wikipedia.org/wiki/List_of_countries_by_GDP_(nominal)
WORLD
INEQUALITY-ADJUSTED HDI
This
is a list of
countries by inequality-adjusted human development index (IHDI), as
published by the UNDP in its 2016 Human Development Report. According
to the 2016 Report, "The IHDI can be interpreted as the level of human
development when inequality is accounted for," whereas the Human
Development Index itself is "an index of potential human development
(or the maximum IHDI that could be achieved if there were no
inequality).
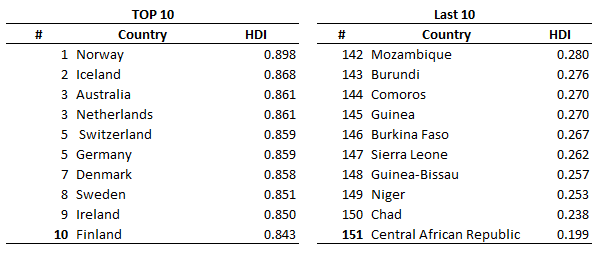
Complete
list:
https://en.wikipedia.org/wiki/List_of_countries_by_inequality-adjusted_HDI
THE
MONTY HALL PROBLEM

Say
you're
on a game show where there are three doors. Behind two of the doors,
there are goats. Behind one of the doors, there is a brand new car.
The
host says that
once you pick a door, he'll open one of the doors you didn't pick to
reveal a goat. Then, you have the option of either staying with your
door or switching to the last unopened door.
Do you
switch or stay?
Answer:
Switch
This
is actually based on a real game show, and the result has been the
source of controversy for years.
Essentially,
when
you first made the selection, you had a one in three chance of
correctly selecting the door that had a car behind it. Switching raised
that probability to two in three that you'll select a car.
Said
another way: A
player whose strategy is to always switch will only lose when the door
they initially selected has a car behind it. A contestant who selects
either of the two doors with a goat behind it and then switches will
always get the car.
Here's
a final way to look at it, provided the contestant selected Door #1
Door 1
Door 2 Door 3 Result if Stay #1 Result if Switch
Car
Goat Goat Car Goat
Goat
Car Goat Goat Car
Goat
Goat Car Goat Car
(straightdope.com)
SIMPSON'S
PARADOX
It
is a
phenomenon in probability and statistics, in which a trend appears in
several different groups of data but disappears or reverses when these
groups are combined. Example:
A
kidney study is
looking at how well two different drug treatments (A and B) work on
small and large kidney stones. Here is the success rate that was found:
Small
Stones, Treatment A: 93%, 81 out of 87 trials successful.
Small
Stones, Treatment B: 87%, 234 out of 270 trials successful.
Large
Stones, Treatment A: 73%, 192 out of 263 trials successful.
Large
Stones, Treatment B: 69%, 55 out of 80 trials successful.
All
stones, Treatment A: 78%, 273 of 350 trials successful.
All
stones, Treatment B: 83%, 289 of 350 trials successful.
Which
is the better treatment, A or B?
Answer:
Treatment A, once you focus on the subsets.
Even
though
Treatment A had higher success rates in both small and large stones,
when the whole trial is viewed as a sample space Treatment B seemed
more successful:
Small
Stones, Treatment A: 93%, 81 out of 87 trials successful
Small
Stones, Treatment B: 87%, 234 out of 270 trials successful
Large
Stones, Treatment A: 73%, 192 out of 263 trials successful
Large
Stones, Treatment B: 69%, 55 out of 80 trials successful.
All
stones, Treatment A: 78%, 273 of 350 trials successful
All
stones, Treatment B: 83%, 289 of 350 trials successful.
This
is an
excellent example of Simpson's Paradox, where correlation in separate
groups doesn't necessarily translate to the whole sample set, causing
ambiguity.
In
short, just because there correlation in smaller groups hides the real
story taking place in the largest of groups.
(businessinsider.com)
DON'T
LET THE P-VALUE MAKE YOU A FOOL!
In a
hypothesis test, if p-value = 0.05, what is the probability of
rejecting H0 incorrectly?
Answer:
5% (this is the wrong answer!); 50% (good chance of being the right
answer).
Believe:
For p-value = 0.05, the probability of rejecting H0 incorrectly is at
least 23% (and typically close to 50%).
Maybe
it's time to rethink your hypothesis tests.
Take
the time to take a look at www.dunamath.com!
Reference:
Sellke,
T., Bayarri, M. J., & Berger, J. O. (2001). Calibration of
ρ
values for testing precise null hypotheses. The American Statistician,
55(1), 62-71.
See more in our group:

|
|